
This article was co-written by David Barnett and Jessica Wolff.
Introduction
Insights into the geographical locations which are most commonly associated with brand infringements have a number of applications in brand protection. This knowledge can help inform policies on where IP protection (such as the registration of relevant trademarks) should be put in place, can identify areas of focus for online monitoring and enforcement, and can provide direction on regions where (if possible and appropriate) on-the-ground initiatives (such as investigations, raids and customs seizures) should be put in place.
When devising a trademark strategy, it is important for a brand owner to consider the countries in which infringements are likely to be encountered. This will typically depend on business model, the goods or services produced, and where infringing activity is already being encountered. It is also advisable to take a wider view, and consider which countries are typically seeing higher levels of infringing activity across all types of business.
In this study, we review a number of separate pieces of research giving information on the countries in which different types of infringing behaviour are typically concentrated. There may be a variety of reasons why certain geographical areas are more popular with infringers, including factors such as the proximity to manufacturing centres and the cost of labour, to differences in local laws, ease of anonymisation for infringers, and the typical policies of service providers operating in these regions. We consider three main areas of relevance (listed below), and create a dataset of infringement frequency ‘scores’ for all relevant countries, for each of these areas:
- Degree to which countries are involved in the manufacture and distribution of counterfeit (and otherwise infringing) goods – including both online and offline channels
- Frequency of association with online service providers used by infringers
- Level of risk of the TLDs (top-level domains, or domain extensions / country codes) associated with each country
In general, each of the above three datasets is composed of multiple sub-datasets, which can be either qualitative – i.e. just lists of countries where infringements are prevalent (in which case, all countries in the list are ‘scored’ equally in our analysis) – or quantitative (in which case, relative scores are used) . In general, when sub-datasets are combined, the values in each sub-dataset are ‘normalised’ (i.e. rescaled) so that the average score is 1, across all of the countries featured in the list. The individual country scores from each sub-dataset can then simply be added together (and the final scores then re-normalised), so that countries featuring in multiple lists are scored more highly. This then allows us to calculate a total ‘infringement risk’ score for each country, encompassing all of the measures considered. Even then, the true picture is likely to be somewhat more complex, as other factors – such as transportation routes for infringing goods – are also likely to come into play when formulating a brand-protection strategy.
Datasets
Dataset 1: Association with counterfeiting activity
This first dataset includes information from four data-sources: lists of countries commonly associated with counterfeiting, as provided by the USTR 2022 Review of Notorious Markets for Counterfeiting and Piracy[1] (which also gives a more granular list of the highest-risk individual online e-commerce marketplaces) and the Wikipedia overview of counterfeiting[2] (which itself draws data from other primary sources, including the Asia Business Council report referenced below); the OECD ‘Global Trade in Fakes’ 2021 report[3],[4], which gives the top 25 countries “in terms of their propensity to export counterfeit products”, quantified as a metric reflecting the value of counterfeit goods and the share of trade in counterfeit goods; and a much older report (2005) from the Asia Business Council[5], giving absolute monetary values of pirated copyright materials used by a list of top infringing countries.
The scores given by just this single combined dataset provide some useful insights in their own right, highlighting the top countries where – broadly – counterfeit goods tend to originate (which is a key area of focus in many brand-protection initiatives). The findings are summarised as a heat map in Figure 1, showing a familiar pattern of counterfeit hotspots particularly in China, Russia, Turkey, South and South-East Asia, and South America.
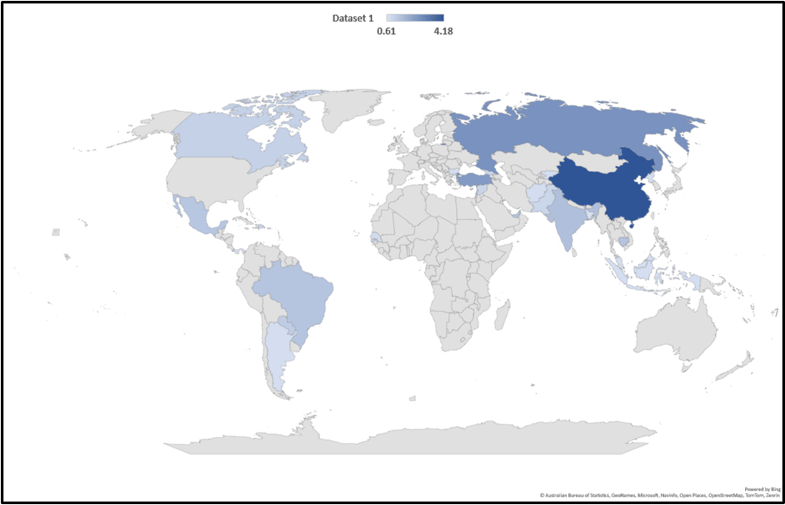
Figure 1: Heat map of degree of country association with counterfeiting activity (dataset 1)
Dataset 2: Service providers used by infringers
In many cases, specific countries or individual service providers (typically domain registrars and web-hosting providers) are disproportionately popular with infringers, based on factors such as cost, degree of customer identity checks, local regulations, and inherent level of service-provider compliance with enforcement requests. The second dataset aims to reflect these points, using information drawn from the following sources:
- Spamhaus’ list of the ten most abused domain registrars[6] (as of 10-Jan-2024), in which each registrar is assigned a ‘badness index’, and from which we take the country in which each of the registrars is based (and assign the ‘badness index’ score to that country, adding the scores together for any countries which feature more than once in the list).
- Information on ‘bulletproof hosting’ (BPH) providers – illicit service providers whose business model specifically states that they are non-compliant to enforcement requests – for which a list of common host countries is given by Wikipedia[7], and a list of ‘best’ individual BPH providers is given by Hostings.info[8]. From these we construct sub-datasets based on both server country location and business country location, in each case ‘multiple counting’ any countries which appear more than once.
It is worth noting that increased levels of IP protection will not necessarily be an effective solution against some of the types of service providers represented within this particular dataset, who – by definition – are likely to be non-compliant even against legitimate enforcement actions. However, it is still meaningful to consider this data in the context of brand protection focus, as many of the factors leading to the concentration of infringements in these regions will still apply more generally.
Dataset 3: Highest-threat TLDs
The third dataset is based on a single study[9], which itself incorporates data drawn from multiple sources (Spamhaus’ list of most abused TLDs, Netcraft’s list of TLDs with the highest cybercrime rates, Palo Alto Networks’ list of TLDs with the highest rate of malicious domains, and CSC’s phishing data), quantifying the frequency with which individual country-code TLDs (ccTLDs) are associated with infringing content. Again, there are a number of reasons why some ccTLDs are popular with infringers, including factors such as domain registration cost and security policies, and even the degree of wealth of the country (which can affect the level of technical expertise of Internet service providers, and therefore the likelihood of compromise)[10].
Overall findings
By combining together the information from the three distinct datasets, we can produce an overall infringement risk score for all countries featured. The findings are shown in Figure 2 and Appendix A.
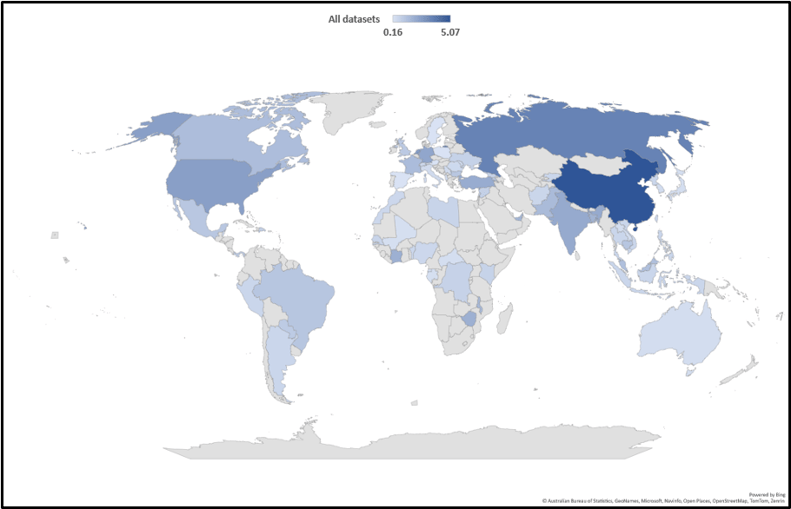
Figure 2: Heat map of overall degree of country association with infringing activity, encompassing all three datasets
This ‘master’ dataset shows a much more widespread geographical distribution of infringement focuses, reflecting the fact that different factors are favourable for the popularity of infringements as measured by the characteristics represented in each of the three distinct datasets. However, some countries and regions do stand out as overall hubs of infringement, notably China and Bangladesh (the only countries to appear in all three datasets, achieving first and twelfth place respectively in the overall rankings), Russia, Hong Kong and India (all of which appear both in datasets 1 and 2), and a number of other centres in North and South America, Europe, Africa, and South-East Asia.
This information provides a key input into formulations of strategies for IP protection and enforcement, although it is always worth bearing in mind that this is just one factor to weigh up against the brand owner’s budget, geographical footprint, expansion plans and other priorities.
Appendix A: Infringement risk scores for all countries featured in any dataset
|
Country |
Infringement risk scores |
|||
|
Dataset 1 |
Dataset 2 |
Dataset 3 |
All datasets |
|
|
China |
4.18 |
1.56 |
0.30 |
5.07 |
|
Russia |
2.64 |
1.50 |
3.47 |
|
|
Netherlands |
3.14 |
2.63 |
||
|
Hong Kong |
0.98 |
2.10 |
2.58 |
|
|
USA |
2.98 |
2.50 |
||
|
Germany |
2.69 |
2.26 |
||
|
India |
1.49 |
1.03 |
2.12 |
|
|
Turkey |
2.44 |
2.05 |
||
|
Ivory Coast |
2.28 |
1.91 |
||
|
Zimbabwe |
2.28 |
1.91 |
||
|
Sint Maarten |
2.15 |
1.80 |
||
|
Bangladesh |
0.65 |
0.67 |
0.80 |
1.78 |
|
United Arab Emirates |
1.44 |
0.60 |
1.71 |
|
|
Malawi |
1.96 |
1.65 |
||
|
Pakistan |
0.94 |
0.90 |
1.54 |
|
|
France |
1.79 |
1.50 |
||
|
Canada |
1.07 |
0.67 |
1.46 |
|
|
Malaysia |
0.73 |
0.90 |
1.37 |
|
|
Singapore |
0.75 |
0.67 |
1.19 |
|
|
Cambodia |
1.40 |
1.18 |
||
|
Armenia |
1.38 |
1.16 |
||
|
Brazil |
1.38 |
1.16 |
||
|
Mexico |
1.34 |
1.12 |
||
|
Bulgaria |
0.73 |
0.60 |
1.12 |
|
|
UK |
1.22 |
1.02 |
||
|
Panama |
0.61 |
0.60 |
1.01 |
|
|
Paraguay |
1.18 |
0.99 |
||
|
Syria |
0.98 |
0.82 |
||
|
Dominican Republic |
0.97 |
0.81 |
||
|
Georgia |
0.92 |
0.77 |
||
|
Ukraine |
0.90 |
0.75 |
||
|
DR Congo |
0.89 |
0.75 |
||
|
Kenya |
0.87 |
0.73 |
||
|
Lebanon |
0.86 |
0.72 |
||
|
Senegal |
0.82 |
0.69 |
||
|
Libya |
0.81 |
0.68 |
||
|
Afghanistan |
0.75 |
0.63 |
||
|
Argentina |
0.73 |
0.61 |
||
|
Indonesia |
0.73 |
0.61 |
||
|
Kyrgyzstan |
0.73 |
0.61 |
||
|
North Korea |
0.73 |
0.61 |
||
|
Peru |
0.73 |
0.61 |
||
|
Philippines |
0.73 |
0.61 |
||
|
Taiwan |
0.73 |
0.61 |
||
|
Thailand |
0.73 |
0.61 |
||
|
Vietnam |
0.73 |
0.61 |
||
|
Benin |
0.72 |
0.60 |
||
|
Morocco |
0.68 |
0.57 |
||
|
Nigeria |
0.67 |
0.57 |
||
|
Switzerland |
0.67 |
0.57 |
||
|
Curaçao |
0.62 |
0.52 |
||
|
Belize |
0.60 |
0.50 |
||
|
Moldova |
0.60 |
0.50 |
||
|
Romania |
0.60 |
0.50 |
||
|
Seychelles |
0.60 |
0.50 |
||
|
Tokelau |
0.57 |
0.48 |
||
|
Albania |
0.57 |
0.48 |
||
|
Italy |
0.55 |
0.46 |
||
|
Palau |
0.55 |
0.46 |
||
|
Serbia |
0.54 |
0.45 |
||
|
South Korea |
0.48 |
0.41 |
||
|
Australia |
0.45 |
0.38 |
||
|
Equatorial Guinea |
0.44 |
0.37 |
||
|
Laos |
0.43 |
0.36 |
||
|
Japan |
0.40 |
0.34 |
||
|
Central African Republic |
0.38 |
0.32 |
||
|
Gabon |
0.37 |
0.31 |
||
|
Mali |
0.36 |
0.30 |
||
|
Austria |
0.22 |
0.19 |
||
|
Poland |
0.22 |
0.19 |
||
|
Sweden |
0.22 |
0.19 |
||
|
Spain |
0.22 |
0.18 |
||
|
British Indian Ocean Territory |
0.19 |
0.16 |
||
[1] https://ustr.gov/sites/default/files/2023-01/2022%20Notorious%20Markets%20List%20(final).pdf
[2] https://en.wikipedia.org/wiki/Counterfeit
[3] https://www.oecd.org/gov/global-trade-in-fakes-74c81154-en.htm
[4] https://www.oecd-ilibrary.org/sites/771e7a68-en/index.html?itemId=/content/component/771e7a68-en
[5] https://www.asiabusinesscouncil.org/docs/IntellectualPropertyRights.pdf
[6] https://www.spamhaus.org/statistics/registrars/
[7] https://en.wikipedia.org/wiki/Bulletproof_hosting
[8] https://hostings.info/hostings/rating/bulletproof-hosting
[9] https://circleid.com/posts/20230117-the-highest-threat-tlds-part-2
[10] https://circleid.com/posts/20230112-the-highest-threat-tlds-part-1
Send us your thoughts:

