
The trade in counterfeit products is a complex picture, involving detailed interactions between the online and offline worlds. The offline (‘real-world’) movement of products is a key element of the overall landscape, encompassing the supply chain for items to be sold online, as well as for physical retailers.
Stobbs’ anti-counterfeiting function assists business with addressing this offline activity, working with customs and law enforcement to intercept and disrupt the transit of infringing goods, and provide intelligence and evidence on their source.
In this case study, we draw supply-chain insights by utilising aggregated data from interceptions and seizures of counterfeit products for three key clients in distinct industry areas:
- Client A: Clothing / apparel
- Client B: Food
- Client C: Manufacturing (tools and accessories)
The wider dataset covers activity which is international in scope, but in this first analysis we focus on activity relating to the UK only; that is, where either the sender (consigner) or recipient (consignee) location or both are in the UK. In the initial study, we consider all instances of sender and recipient locations together as a single dataset (since, in principle, both may represent intermediate stages in the overall supply chain of the infringing goods).
In order to provide a low-granularity overview, each location (usually represented as a full physical address) is assigned to its host town / city (hereafter referred to as the ‘town’). From this dataset, we produce a bubble chart ‘heat map’, where the size of the circle for each town is proportional to the number of times it appears in the overall dataset (i.e. the frequency of its association with the trade in counterfeit goods as a transit point)[1]. This overview is shown in Figure 1.
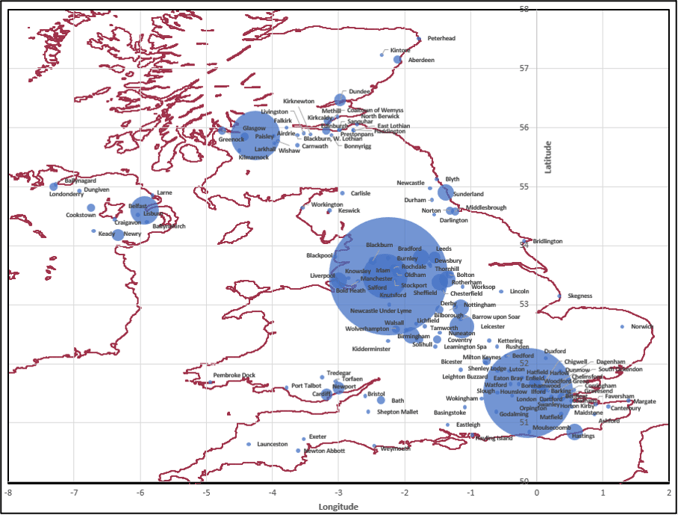
Figure 1: Bubble chart ‘heat map’ showing the frequency with which each town has been the identified location of a sender or recipient of counterfeit goods[2]
The top level trends in the UK locations of counterfeit hostspots, as shown by the data visualisation, are as follows:
- Much of the activity is concentrated in a geographical brand running from south-east to north-west, with primary centres in and around Manchester, London, and Glasgow.
- Secondary centres of activity are apparent in Northern Ireland, the West Midlands, Edinburgh and eastern Scotland, and north-east England.
- Other features highlighted on the heat map include the transit routes between Glasgow and Edinburgh, and key port locations (e.g. Hastings, Newport, Aberdeen, Bridlington, etc.)
Detailed views of some of the key areas of focus are shown in Figure 2.
(a)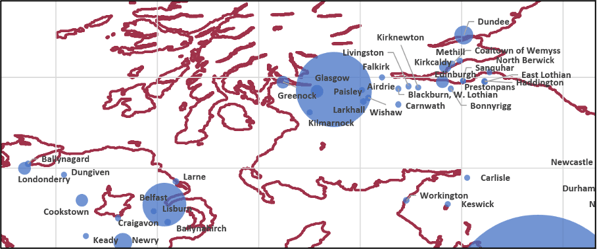
(b)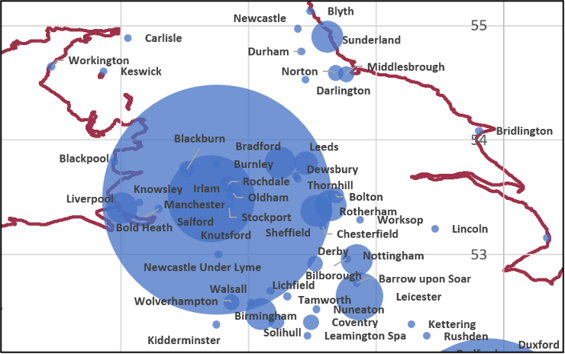
(c)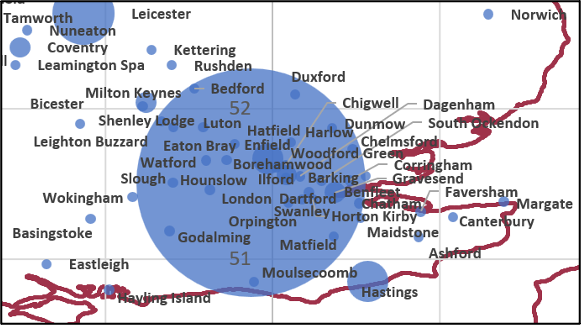
Figure 2: Detailed views of the counterfeit activity ‘heat map’: (a) southern Scotland and Northern Ireland; (b) Manchester and surroundings; (c) London and surroundings
It is then possible to conduct deeper dives within a specific town / region by mapping the specific locations at a postcode level. For Manchester (the largest overall focus of activity) for example, also encompassing the overlapping areas of Salford, Stockport, Oldham, Rochdale and Irlam, the distribution of the individual locations identified as being associated with the trade in counterfeit goods is as shown in Figure 3.
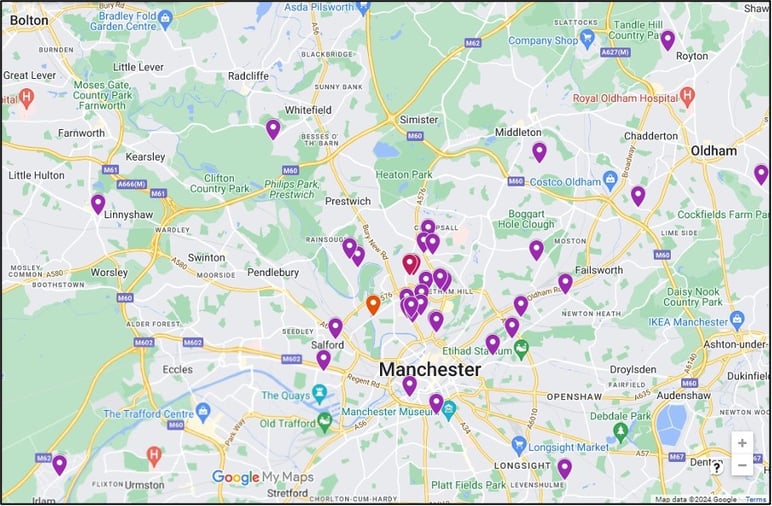
Figure 3: Individual locations of interest within the Manchester region (postcodes appearing twice in the dataset shown using pink markers; three times using orange markers)
This type of analysis can help to inform decisions on locations where further on-the-ground investigations and scoping exercises may prove fruitful. In the case of the Manchester mapping exercise, for example, the analysis successfully highlights a cluster of activity around the Cheetham Hill area to the north of the city, long recognised as a real-world location involved in the sale of counterfeit items[3].
In the next part of this analysis, we carry out a more granular analysis of the data, separating out origin locations from destination locations. This helps us gain insights into the routes by which counterfeits are arriving into the country in cases where they are imported from overseas. It also highlights the regions from which they originate (to provide guidance on where customs training initiatives should be focused), and into locations from which counterfeit sales are being distributed (which may form the focuses of further on-the-ground investigation work).
[1] Note that there may be some ‘overlap’ within the data – e.g. in some cases a location of Rochdale or Oldham may have been categorised as being within the broader ‘Manchester’ area; however, the overall clustering of the data is still apparent from the final visualisation
[2] Coastline data source: https://www.evl.uic.edu/pape/data/WDB/
[3] https://www.bbc.co.uk/news/uk-england-manchester-67292006
Send us your thoughts:

